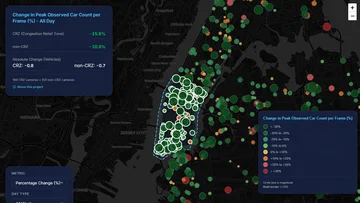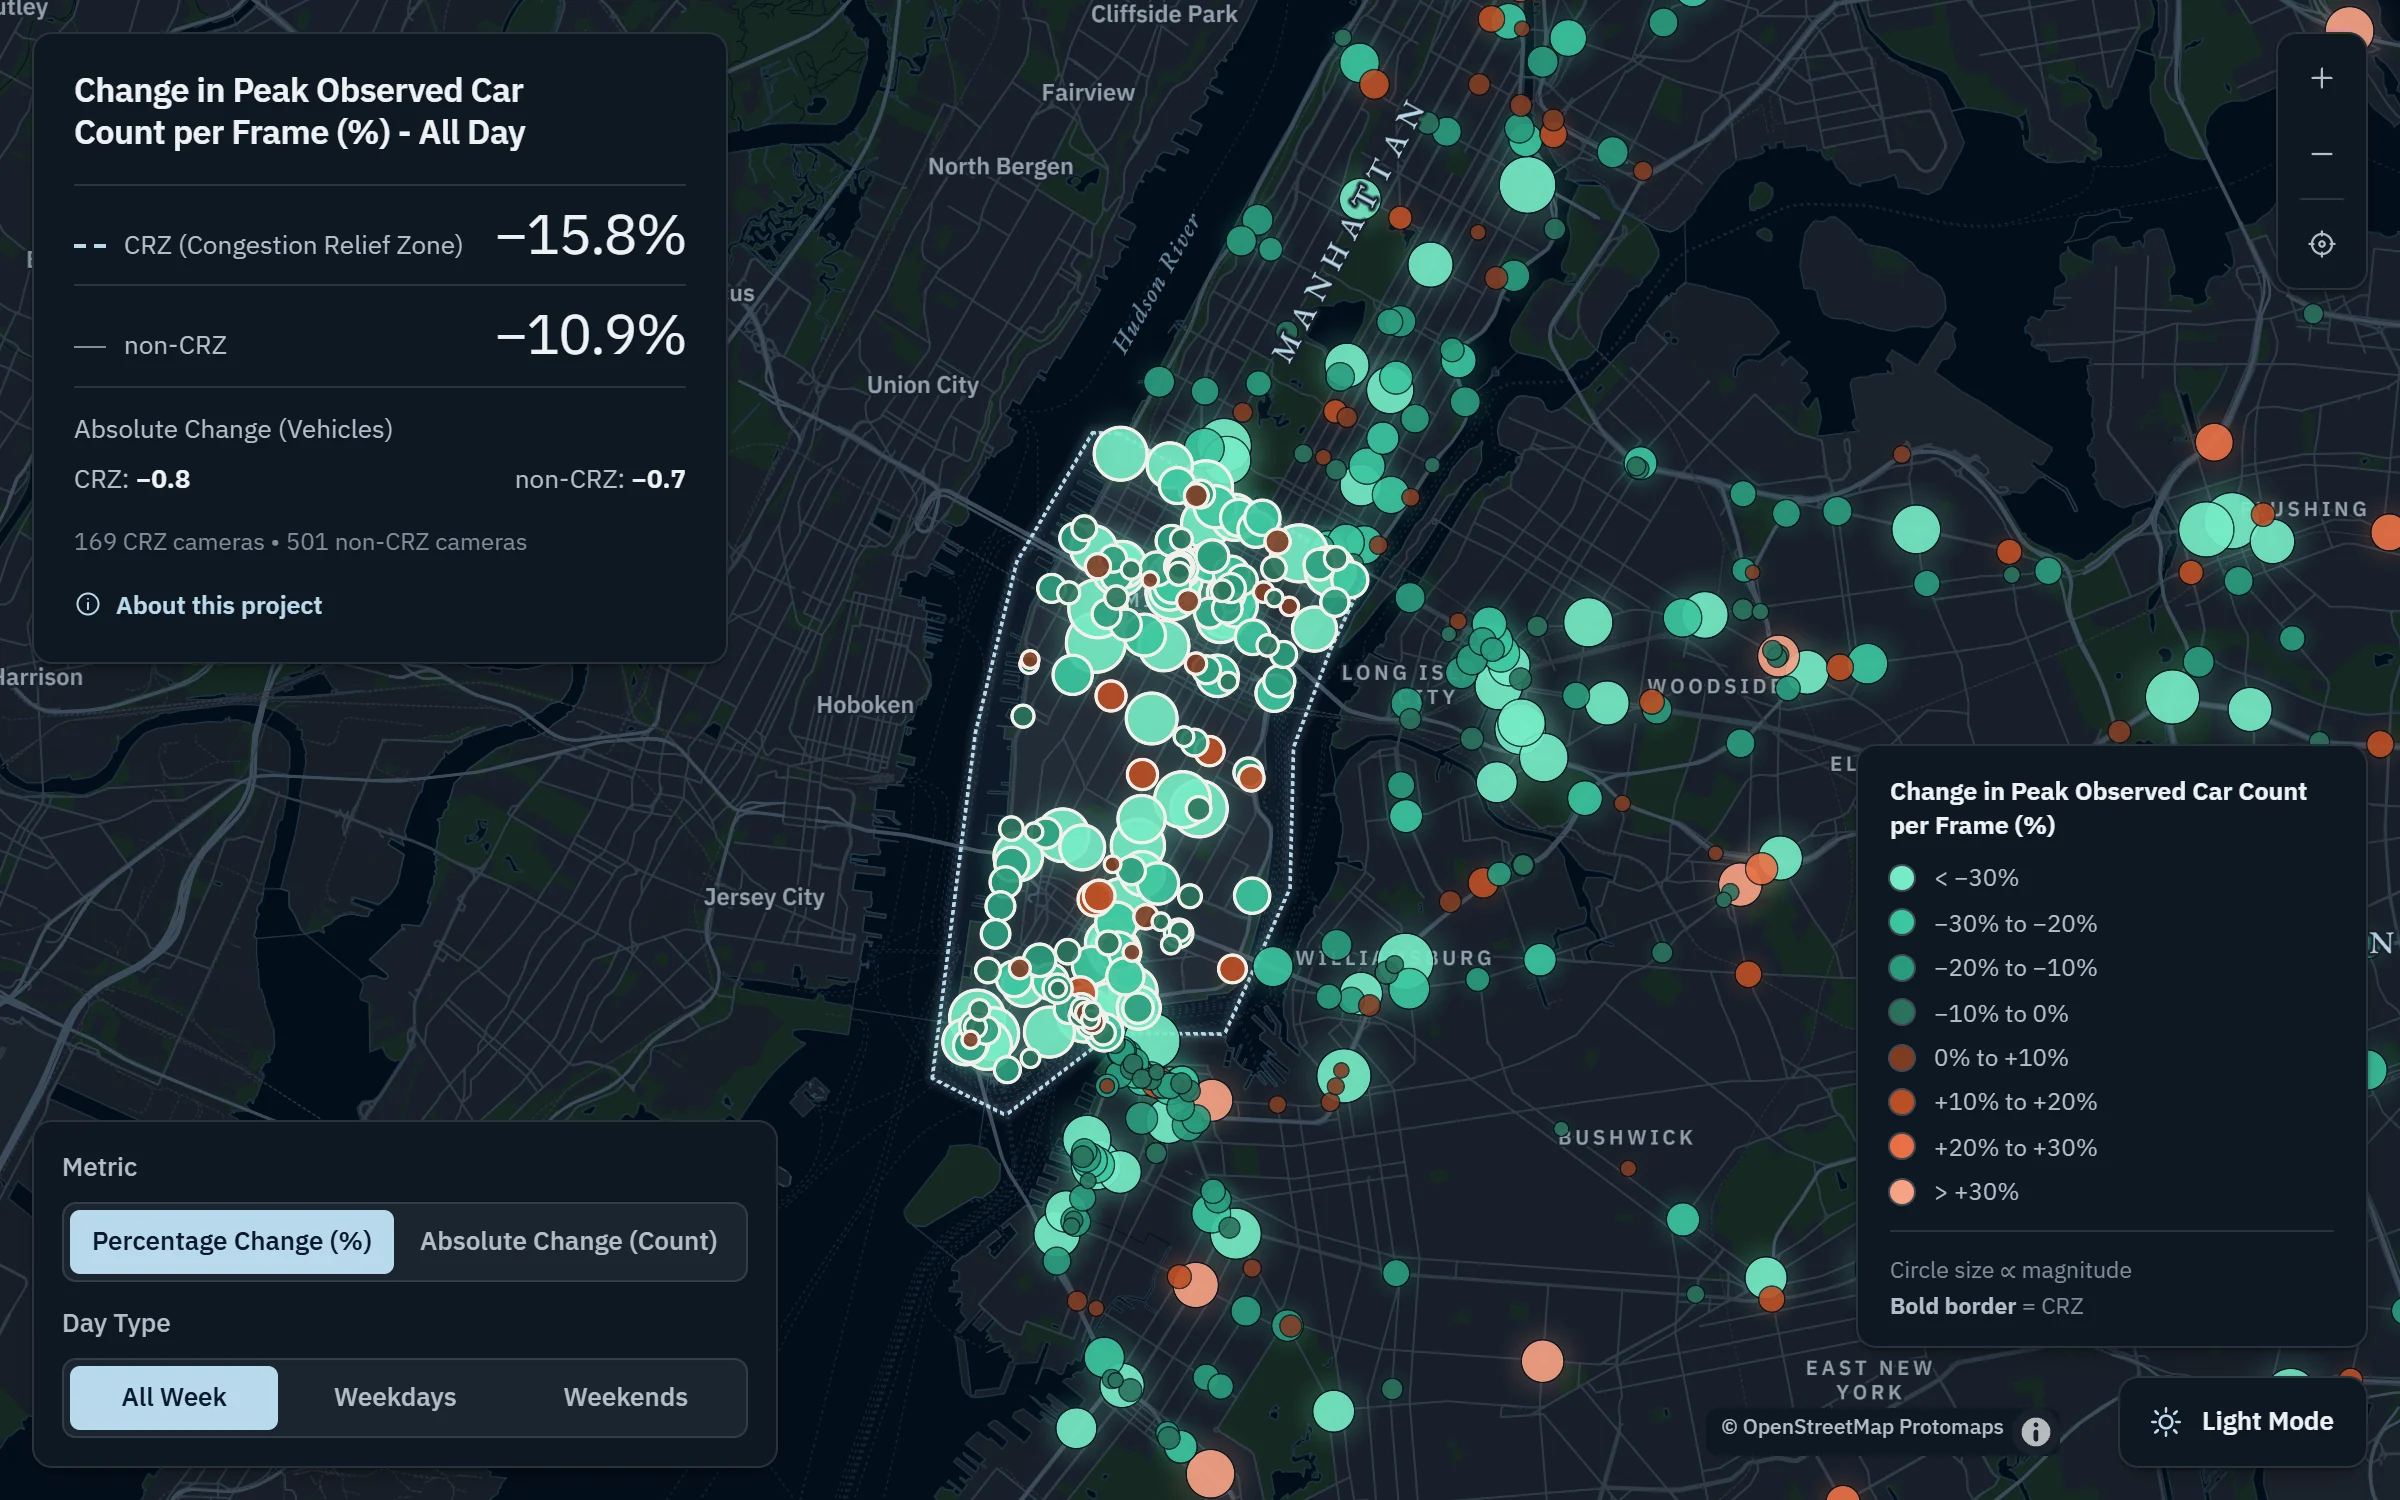
In January 2025, New York City began charging vehicles to enter Manhattan’s Congestion Relief Zone (CRZ), the first program of its kind in the United States. This project measures the policy’s effect directly from the street. A computer vision pipeline counts vehicles in footage from the city’s public traffic cameras, and traffic in the same November 14 to January 4 window is compared before and after the policy, with anomalous periods such as holidays excluded from the baselines.
Method
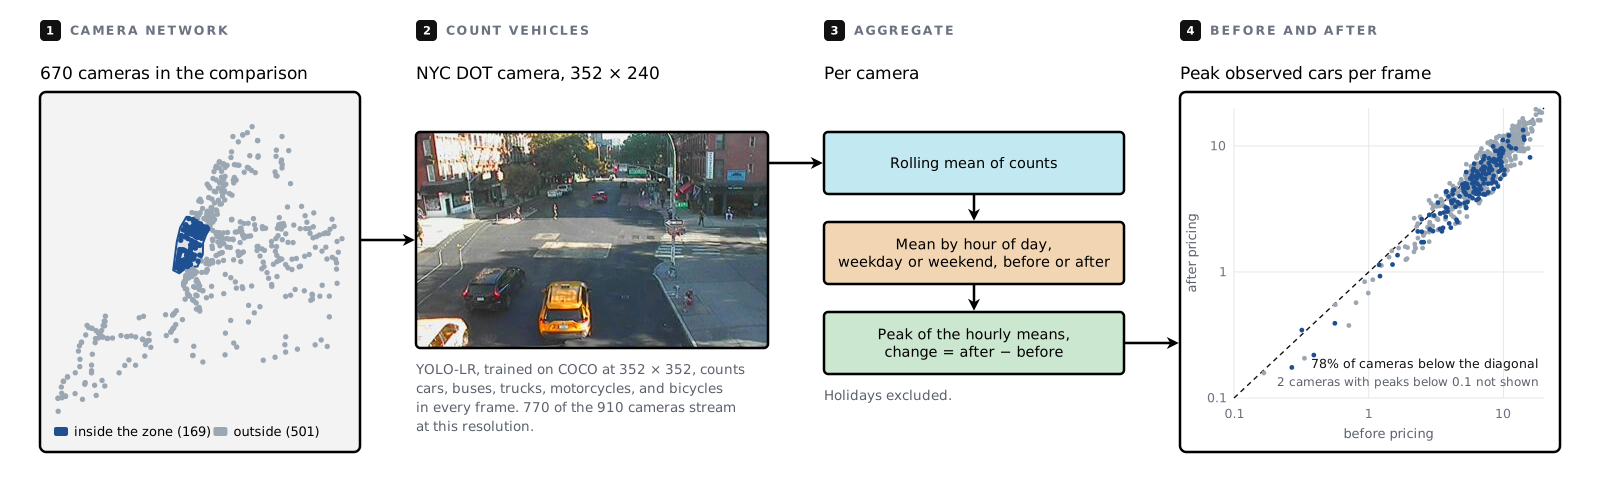
Each camera contributes instantaneous vehicle counts from object detection. The counts are aggregated into hourly averages across a typical week, so rush-hour peaks, weekday and weekend patterns, and the before-and-after difference can be compared at every camera and mapped across the city.
Results
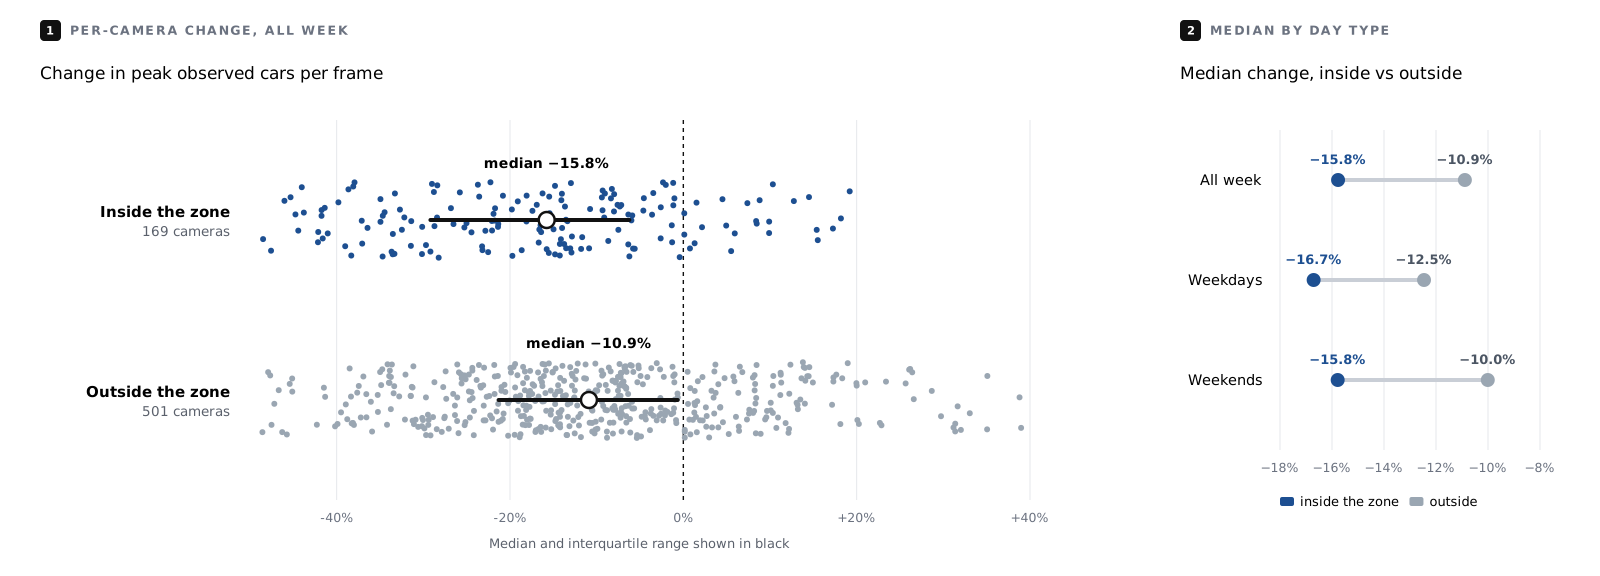
- Traffic fell inside the zone. Peak observed car count per frame dropped 15.8% at cameras within the CRZ.
- Traffic also fell outside the zone. Cameras outside the CRZ recorded a smaller 10.9% drop in peak observed car count per frame.
- Changes are resolved camera by camera. The interactive map reports each camera’s change as a percentage or an absolute count, for the whole week, weekdays only, or weekends only.
Live view
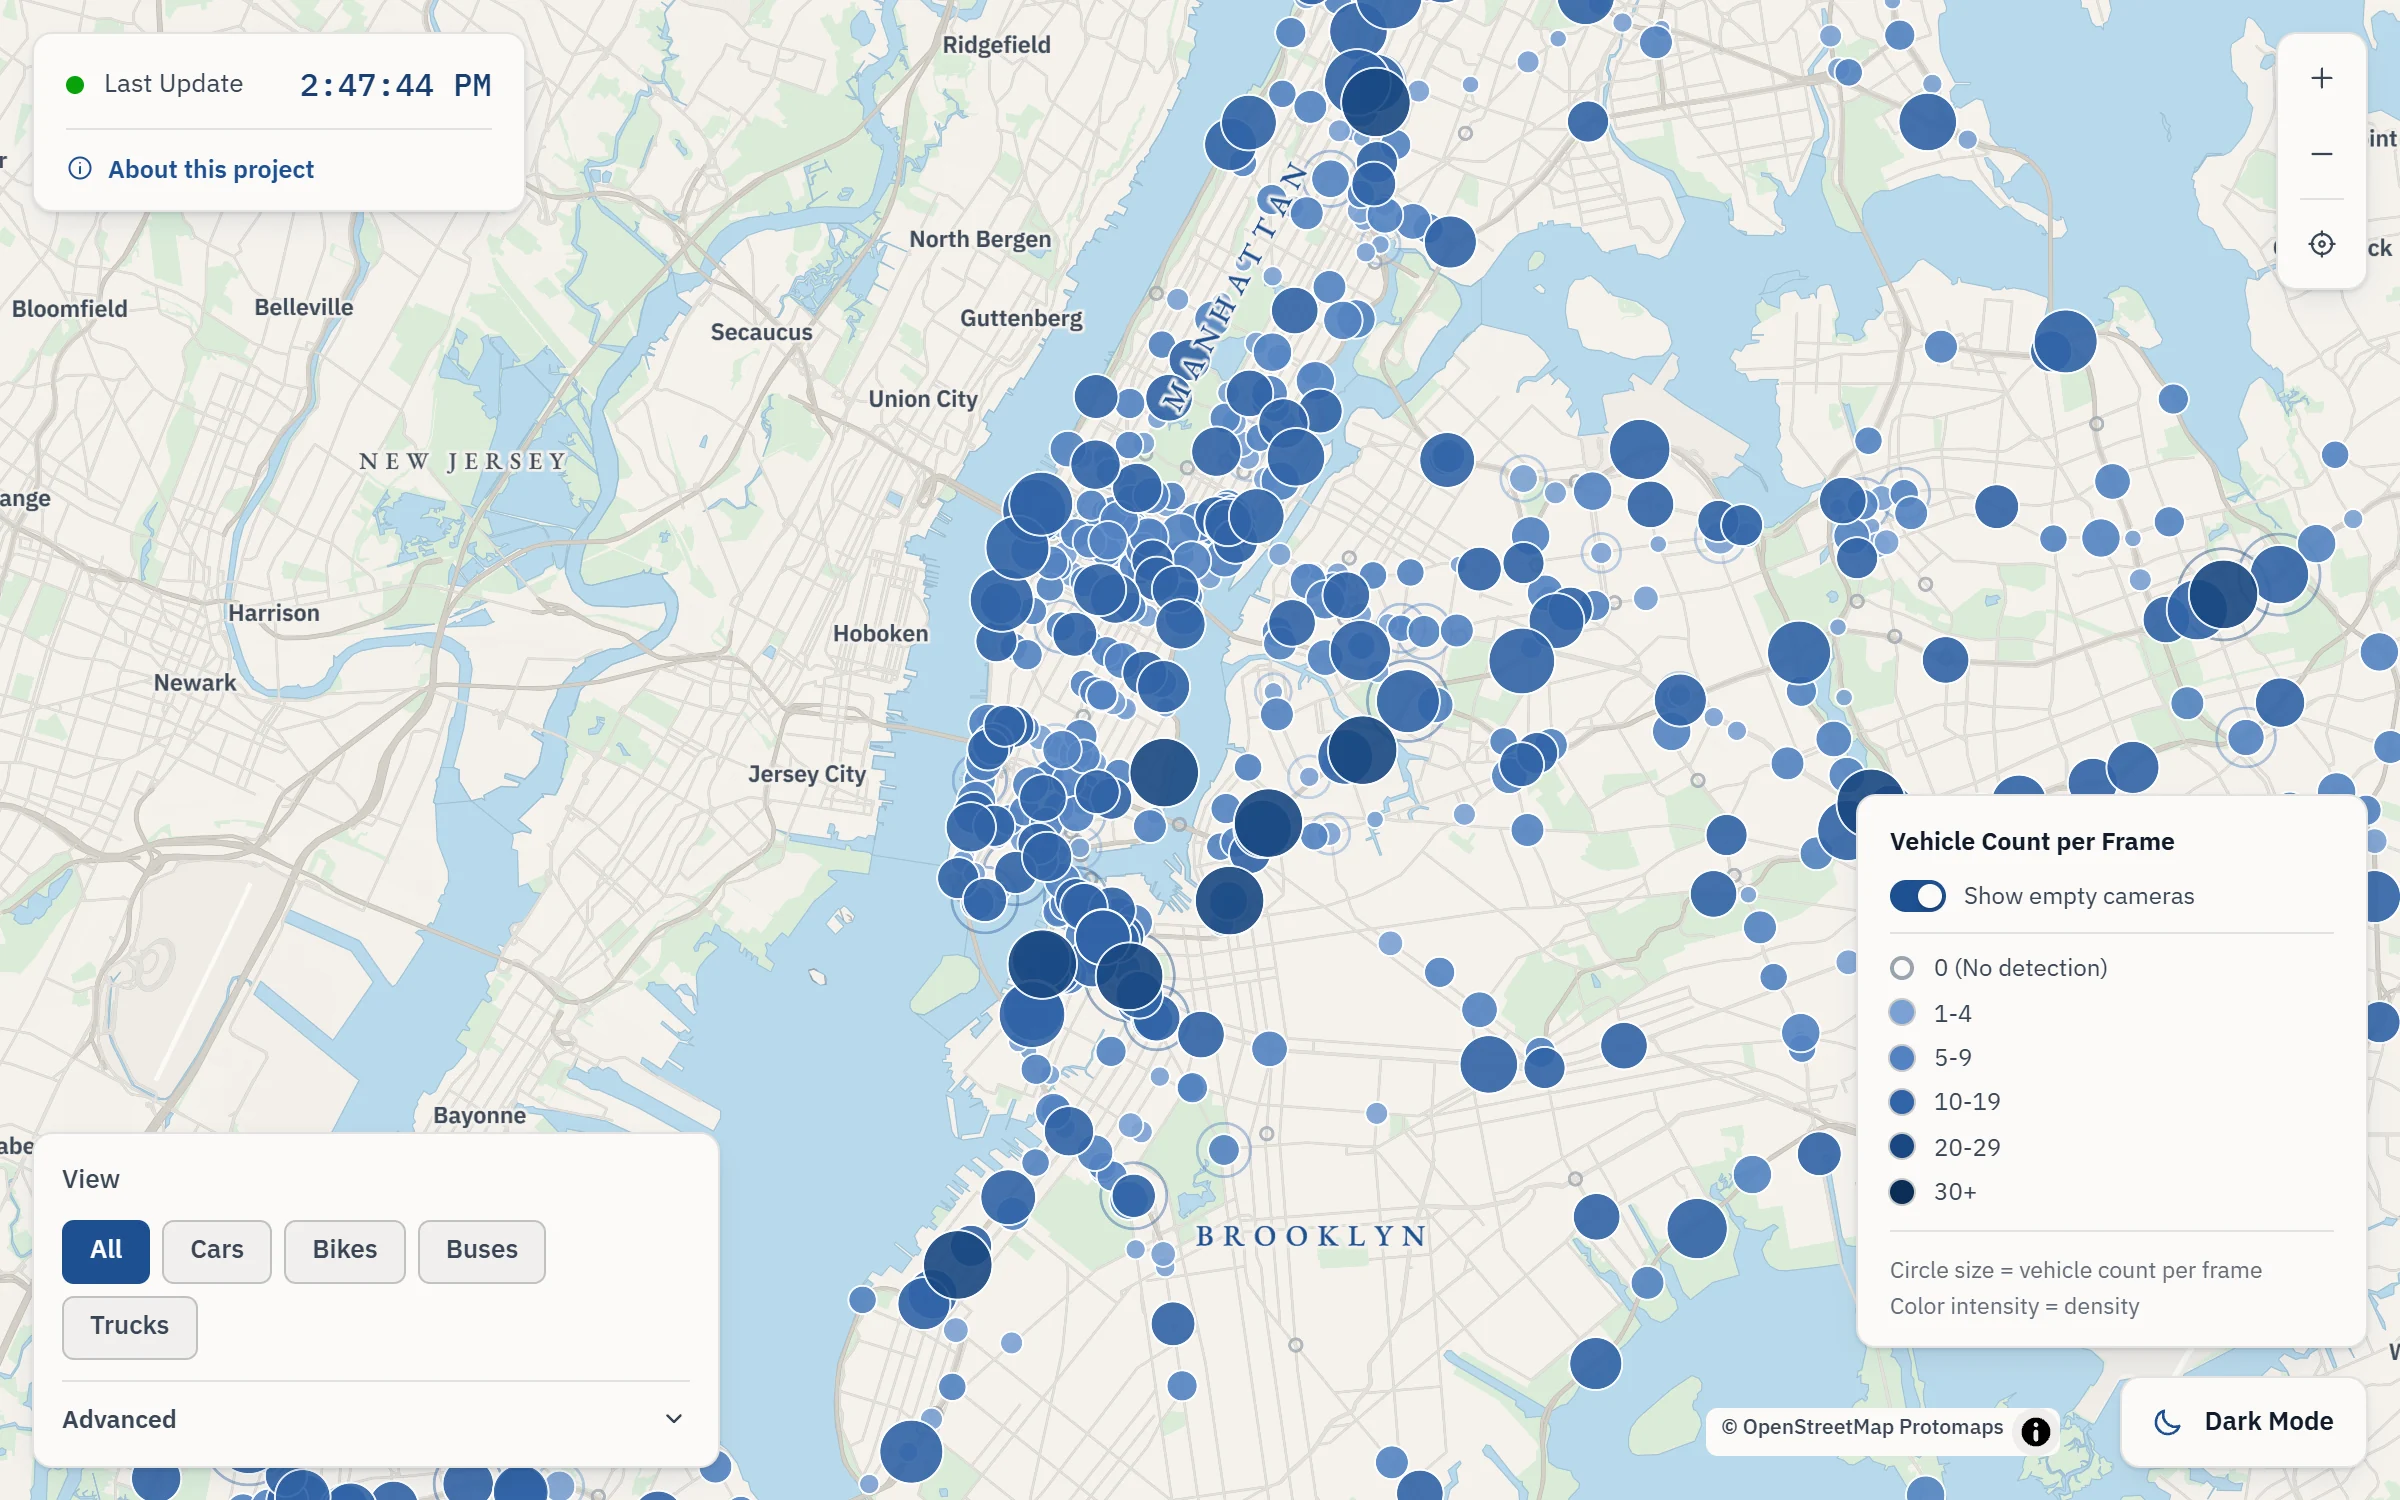
The analysis is ongoing, with regular updates to track how traffic evolves under the policy over the long term. A companion real-time map shows the camera network as the pipeline processes it.
Limitations
Camera-based vehicle counts are a proxy for traffic, not a direct measure of travel times or congestion. The current pipeline includes stationary vehicles, which can raise measured density on streets with heavy parking, and it measures aggregate flow without separating individual lanes or travel directions.