Quick start
Valdrada runs as a simulation server. The server renders the city and simulates its traffic, and your Python code drives it over TCP (port 2000): it moves cameras, spawns vehicles and pedestrians, steps the world and receives images and labels. This page gets a first frame on disk. Option A uses the published release, option B a source checkout. The installation guide covers requirements, servers without a display and common errors.
Option A: the release
Windows
The release archive contains the server, the compiled city (Content/) and the Python package.
- Download
Valdrada-0.3.1-win64.zip(about 2 GB) from the releases page and extract it. - In the extracted folder
Valdrada_0.3.1_win64, double-clickStartServer.bat. A window opens; on the first start the city appears after one to two minutes, while the shaders compile.StartServer_Headless.batstarts the same server without a window. -
Open a terminal in that folder and install the Python package:
-
Save the example at the end of this page as
first_frame.pyand run it withpython first_frame.py.
Linux
The release has no Linux executable. The same server runs from a source checkout on the Electron runtime that npm
installs, with the release's Content/ from the dataset (3.9 GB):
git clone https://github.com/mkturkcan/valdrada.git
cd valdrada
(cd server && npm install)
pip install -U "huggingface_hub>=1.0"
hf download mehmetkeremturkcan/valdrada --repo-type dataset --revision v0.3.1 --include "Content/*" --local-dir .
cd server
env -u ELECTRON_RUN_AS_NODE npx electron . --content ../Content
In a desktop session this opens the server window. On a machine without a display, start it headless instead:
env -u ELECTRON_RUN_AS_NODE npx electron . --content ../Content --headless \
    --ozone-platform=headless --use-angle=vulkan --enable-features=Vulkan
The server prints listening on 127.0.0.1:2000 at once and world ready when the city has loaded. Then, in a second
terminal at the top of the checkout:
Option B: from source
A source checkout runs the client in a Vite development server and the simulation server on top of it. It needs Node.js 22.12 or later. The tiles, models and textures (3.8 GB) come from the dataset. On Windows, run these commands in Git Bash.
git clone https://github.com/mkturkcan/valdrada.git
cd valdrada
npm install
(cd client && npm install)
(cd server && npm install)
pip install -U "huggingface_hub>=1.0"
hf download mehmetkeremturkcan/valdrada --repo-type dataset --revision v0.3.1 \
    --include "Content/tiles/*" --include "Content/models/*" --include "Content/textures/*" --local-dir .cache/hf
mv .cache/hf/Content/tiles .cache/hf/Content/models .cache/hf/Content/textures client/public/
Start the client and the server, each in its own terminal:
cd client && npm run dev        # the client on http://127.0.0.1:5219; open it in a browser to look around
cd server && npm run dev             # the simulation server on port 2000, showing that client
On a Linux machine without a display, start the server with
env -u ELECTRON_RUN_AS_NODE npx electron . --dev-url=http://127.0.0.1:5219 --headless --ozone-platform=headless --use-angle=vulkan --enable-features=Vulkan
in server/. Then install the package and run the example from a third terminal:
The compiler can also build the tiles from the city's public records instead of downloading them; see Building from source.
Your first frame
The script below connects to the server, moves the spectator to W 120th St and Amsterdam Ave, waits until that part
of the city has streamed in, places an RGB camera and a bounding box camera at the same pose, and steps the world once.
Both cameras deliver their data for that step before world.tick() returns. The same script is
PythonAPI/examples/data_collection/first_frame.py.
import valdrada
from valdrada import Location, Rotation, Transform

world = valdrada.Client("127.0.0.1", 2000).get_world()
spot = world.get_map().geolocation_to_location(40.80955, -73.95905)   # W 120th St and Amsterdam Ave
pose = Transform(spot + Location(-30, -30, 12), Rotation(pitch=-15, yaw=45))
world.get_spectator().set_transform(pose)                              # the city streams in around the spectator
world.wait_until_loaded()
lib = world.get_blueprint_library()
rgb, boxes = (world.spawn_actor(lib.find("sensor.camera." + kind), pose) for kind in ("rgb", "bounding_boxes"))
rgb.listen(lambda image: print(image.save_to_disk("_out/rgb.png")))
boxes.listen(lambda labels: print(labels.save_to_disk("_out/boxes.json"), len(labels.labels), "objects"))
world.tick()                                                           # one step: both files exist when it returns
rgb.destroy(), boxes.destroy()
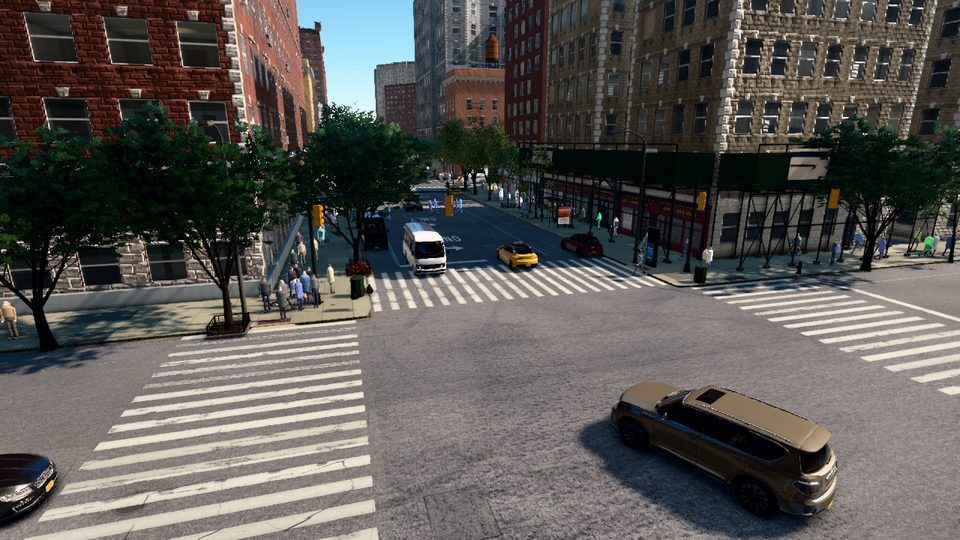
It prints the two paths and the number of labelled objects. _out/rgb.png is a 1280 × 720 image of the
intersection; _out/boxes.json lists every object in view with its class, its visible box [x, y, w, h] in pixels
and, for vehicles, pedestrians and street furniture, its position and size in the world. With the default traffic a
run labelled 129 objects, 60 of them pedestrians.
Positions are metres east, north and up from 40.7831 N, 73.9712 W; rotations are degrees, with yaw counter-clockwise from east. Next: the data collection guide records depth, segmentation, 3D boxes and sequences, and the tutorials explain the API step by step.